Sales Reports
Sales Reports
You may monitor the sales performance of your business and analyze sales data from many angles to see the performance. You can dynamically alter what is displayed by using filters. The Sales Analytics Report is composed of three window areas: the Data Window, the Graph Window, and the Filter Toolbar Window, as illustrated below:
You may find these analytics under:
Home > Selling > Key Reports
1. Sales Analytics Report
Go to Selling > Analytics > Sales Analytics. The Sales Analytics report looks like this:
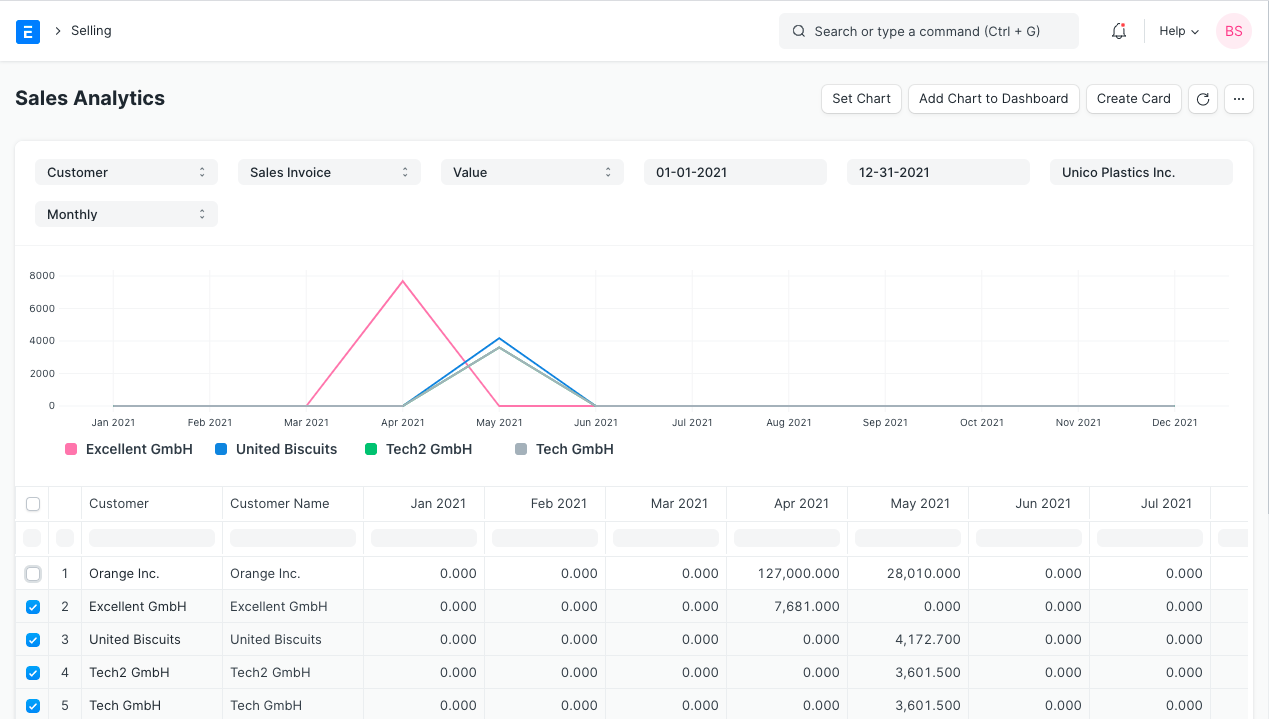
To choose which data to utilize, use the filters on the toolbar. The data displayed can be filtered using the dropdown menu options. Data is updated when choices are made, both in the graph window and the data window.
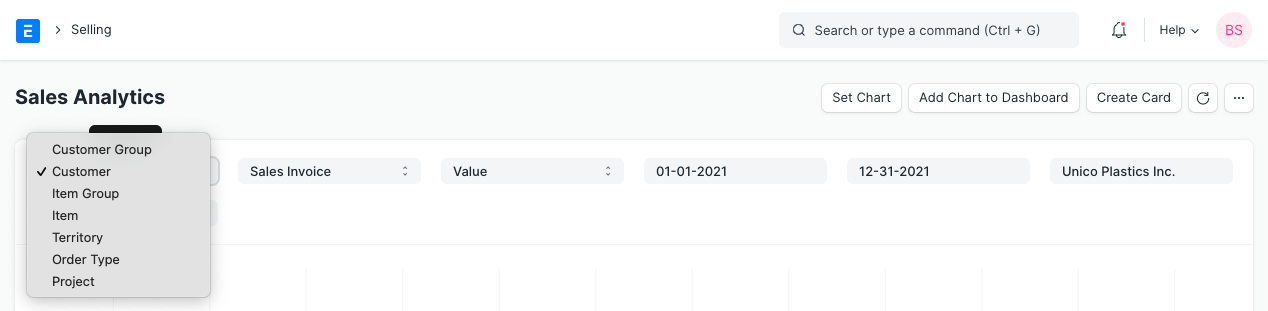
There are options to enlarge or compress the data that will be evaluated inside the data window. You can check or uncheck each box. A higher level can be compared to a lower level since there are no restrictions on data comparisons.
The "Set Chart" option allows you to choose a chart type, values for the X and Y variables, and a color.
2. Sales Funnel Report
Go to Analytics > Selling. A sales generating analysis is provided in the report "Sales Funnel." It shows how the various stages of the sales process progress. A sales order goes through four stages: active leads, opportunities, quotations, and converted leads (has become a Customer).
The number of all your leads, including those in the other stages, is displayed under Active Leads.
Opportunities list the Leads for which a certain Opportunity was made.
The quantity of leads for which a quotation was filed is shown in the quotation.
Converted displays the quantity of leads for which a sales order and quotation were filed.
Usually, the later stages are included with the early stages. Yet if a previous step was neglected, you can observe paradoxical outcomes, such as two Quotes coming from a single Opportunity (because it is not mandatory to create an Opportunity first).
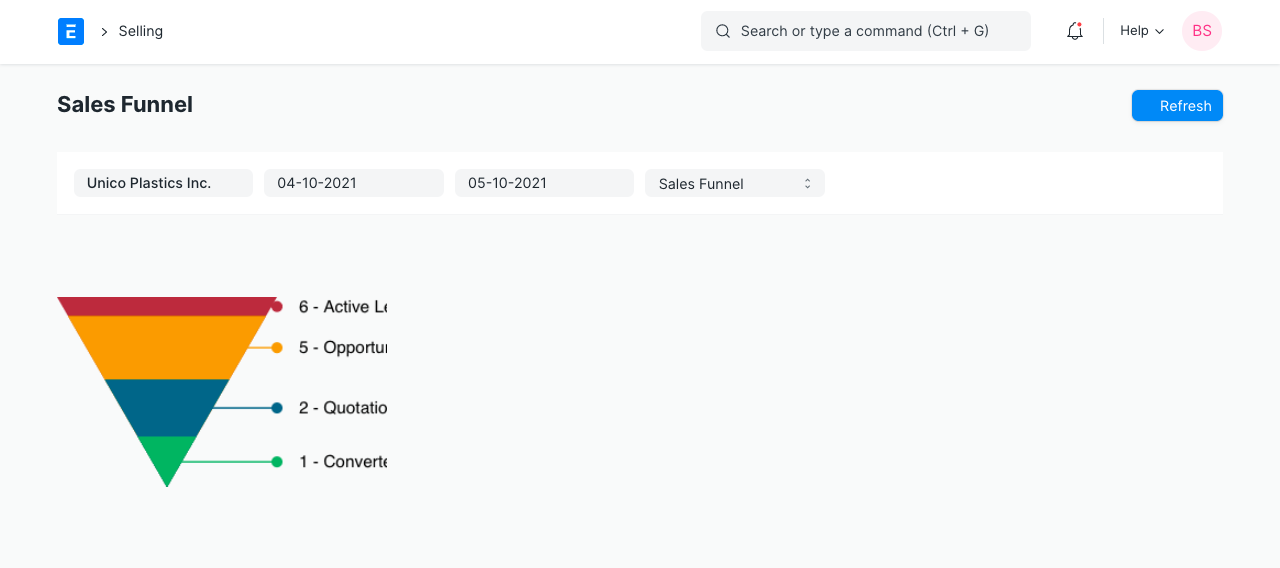
The graph is updated to reflect the changes and the accompanying labels after a date range has been chosen.
3. Customer Acquisition and Loyalty Report
Go to Analytics > Selling. Looking at the data from the perspectives of new customers and existing customers can frequently be helpful in understanding revenue. This paper provides an illustration of client loyalty. This report has two windows: the Data Window and the Filter Window.
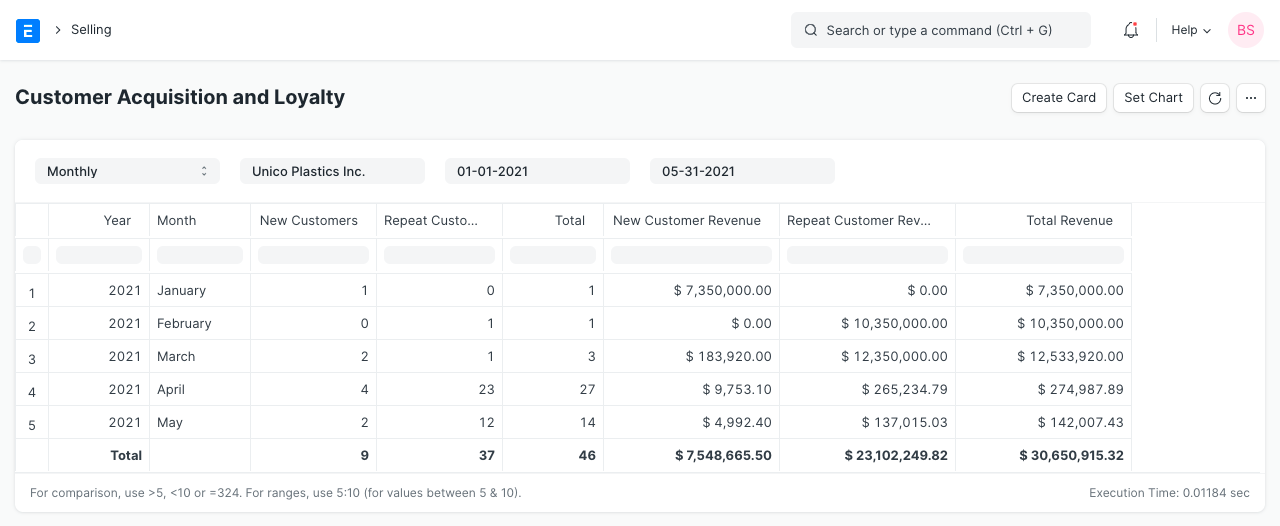
You can apply the company and date ranges by going to the Filter Window. As modifications are made, data is updated in the Data Window.
Information is available in columns within the Data Window.
- Moving columns: By clicking and dragging the column titles, the columns can be shifted or rearranged.
- Sorting: You can choose to sort the columns of data in ascending or descending, reset the sorting, or remove a column by clicking on the right side of a column heading.
- Filtering: Instant filters are available in the text boxes located beneath the column headings. There, you can enter a number to see all records that match that number.
In the Selling module, there are reports under Key Reports for Inactive Clients, Ordered Goods To Be Delivered, Sales Person-wise Transaction Overview, Item-wise Sales History, Quotation Trends, and Sales Order Trends.
There are reports for the following under the Other Reports section:
- Lead Details
- Customer Addresses And Contacts
- BOM Search
- Available Stock for Packing Items
- Pending SO Items For Purchase Request
- Customer Credit Balance
- Customers Without Any Sales Transactions
- Sales Partners Commission